

Spectra and parameter sweeps
Track an avoided crossing, inspect its dressed-state assignments, and compare a fluxonium model with published spectroscopy and readout data.
quchip uses GHz for frequencies and couplings.
Declare the coupled model
Sweep one transmon through the other, where their bus-mediated interaction
produces an avoided crossing. For this study, use RWA() in a rotating
frame.
import json

import matplotlib.pyplot as plt
import numpy as np

from quchip import RWA, Capacitive, ChargeDrive, Chip, DuffingTransmon, Resonator, SpectrumSweep, Sweep

q1_frequency = 5.30
q2_frequency0 = 5.58
bus_frequency = 6.55
q2_frequencies = np.linspace(5.255, 5.345, 181)
coupling_strength = 0.050

q1 = DuffingTransmon(
    freq=q1_frequency,
    anharmonicity=-0.65,
    levels=4,
    label="q1",
)
q2 = DuffingTransmon(
    freq=q2_frequency0,
    anharmonicity=-0.65,
    levels=4,
    label="q2",
)
bus = Resonator(freq=bus_frequency, levels=4, label="bus")

chip = Chip(
    [q1, q2, bus],
    couplings=[
        Capacitive(q1, bus, g=coupling_strength, label="q1-bus"),
        Capacitive(q2, bus, g=coupling_strength, label="q2-bus"),
    ],
    frame="rotating",
    approximation=RWA(),
)
Sweep the avoided crossing
Sweep names the public parameter path to change. SpectrumSweep builds
an isolated chip at each point, so the original declaration does not
change. overlap_threshold=0.0 keeps both intentionally hybridized
one-excitation labels available at the centre of the avoided crossing.
frequency_axis = Sweep(q2_frequencies, name="q2.freq")
sweep_result = SpectrumSweep(
    chip,
    [frequency_axis],
    evals_count=4,
    overlap_threshold=0.0,
).run(progress=False)
Subtract the ground energy from the two qubit-like branches. The bus-like excitation stays above this frequency window.
ground_energy = sweep_result.eigenvalues[:, 0]
qubit_branches = sweep_result.eigenvalues[:, 1:3] - ground_energy[:, None]
lower_branch = qubit_branches[:, 0]
upper_branch = qubit_branches[:, 1]
splitting = upper_branch - lower_branch
q1_branch = sweep_result.dressed_index(q1=1, q2=0, bus=0).astype(int) - 1

minimum_index = int(np.argmin(splitting))
minimum_splitting = float(splitting[minimum_index])
minimum_frequency = float(q2_frequencies[minimum_index])
inferred_exchange_rate = 0.5 * minimum_splitting

q1_assignment = sweep_result.dressed_index(q1=1, q2=0, bus=0)
q1_label = (1, 0, 0)
q1_label_position = sweep_result.bare_labels.index(q1_label)
q1_assignment_overlap = np.asarray(
    sweep_result.assignment_overlaps[..., q1_label_position]
)
Plotting code
import shutil

plt.style.use("../docs/_static/quchip.mplstyle")
plt.rcParams["text.usetex"] = bool(shutil.which("latex"))

figure, (axis, overlap_axis) = plt.subplots(
    2,
    1,
    figsize=(7.4, 6.2),
    height_ratios=(3.0, 1.0),
    sharex=True,
    layout="constrained",
)

axis.plot(q2_frequencies, q2_frequencies, color="#9AA0A8", linestyle="--", linewidth=1.1)
axis.axhline(q1_frequency, color="#9AA0A8", linestyle="--", linewidth=1.1, label="bare declarations")
for branch_index in (0, 1):
    q1_like = q1_branch == branch_index
    axis.plot(
        q2_frequencies,
        np.where(q1_like, qubit_branches[:, branch_index], np.nan),
        color="#C92F33",
        linewidth=2.3,
        label="$q_1$-like" if branch_index == 0 else None,
    )
    axis.plot(
        q2_frequencies,
        np.where(~q1_like, qubit_branches[:, branch_index], np.nan),
        color="#16181C",
        linewidth=2.3,
        label="$q_2$-like" if branch_index == 0 else None,
    )
axis.annotate(
    f"$2J$ = {1.0e3 * minimum_splitting:.1f} MHz",
    xy=(minimum_frequency, 0.5 * (lower_branch[minimum_index] + upper_branch[minimum_index])),
    xytext=(40, -40),
    textcoords="offset points",
    arrowprops={"arrowstyle": "-", "color": "#6D7277", "linewidth": 0.8},
    fontsize=10,
)
axis.set(
    ylabel="Transition frequency (GHz)",
    xlim=(q2_frequencies[0], q2_frequencies[-1]),
)
axis.legend(frameon=False, ncols=2, loc="upper left")

overlap_axis.plot(
    q2_frequencies,
    q1_assignment_overlap,
    color="#246FA8",
    linewidth=2.0,
)
overlap_axis.axhline(0.5, color="#9AA0A8", linestyle="--", linewidth=1.0)
overlap_axis.set(
    xlabel="Bare q2 frequency (GHz)",
    ylabel=r"$q_1$ assignment",
    ylim=(0.45, 1.02),
)

figure_path = "../docs/images/resolve_and_sweep.svg"
figure.savefig(figure_path)
plt.show()
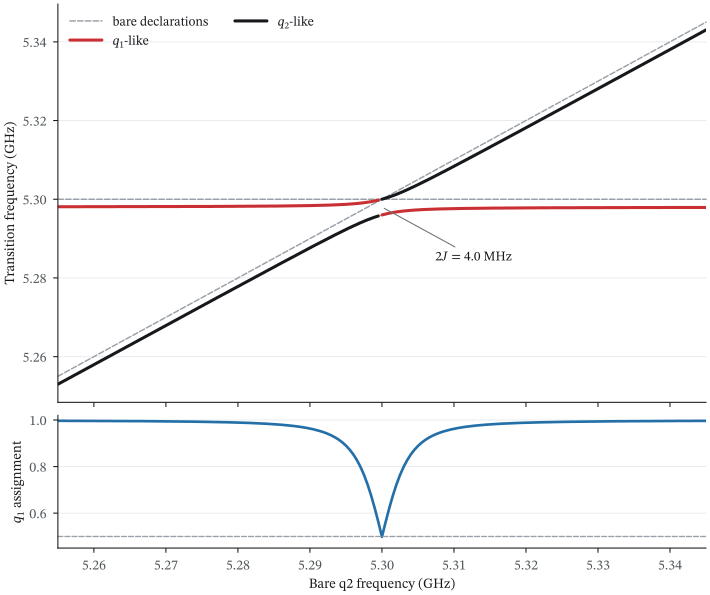
The bare declarations cross while the dressed transitions retain a finite splitting. The assignment weight exposes the hybridized region directly.
The dashed lines are the bare declarations. Red follows the more \(q_1\)-like
dressed transition, and black the more \(q_2\)-like one. At the crossing, the
branch separation is \(2J\approx4.0\) MHz. Second-order dispersive perturbation
theory gives \(4.0\) MHz, and the two agree to 0.3%. The RWA drops the
counter-rotating coupling bands. With Exact(), their Bloch–Siegert shift
raises the splitting to approximately 4.4 MHz.
The lower panel shows why a bare-state label needs care at the crossing: its assignment weight decreases to approximately one half as the two excitations hybridize.
Inspect the model after the sweep
The declared frequencies are inputs. chip.freq() returns dressed
\(0\rightarrow1\) transitions, and chip.static_zz() returns the
conditional two-qubit shift for this coupled model.
q1_line = ChargeDrive(q1, label="q1-charge")
_ = chip.wire(q1_line)

initial_dressed_frequencies = {
    "q1": float(chip.freq(q1)),
    "q2": float(chip.freq(q2)),
    "bus": float(chip.freq(bus)),
}
initial_static_zz = float(chip.static_zz(q1, q2))
kerr = chip.kerr_matrix()

assert np.isclose(kerr[q1, q1], chip.dressed_anharmonicity(q1))
assert np.isclose(kerr[q1, bus], chip.dispersive_shift(q1, bus))

static_snapshot = {
    "q1_f01_ghz": float(chip.freq(q1)),
    "q1_f12_ghz": float(chip.transition_frequency(q1, 1, 2)),
    "kerr_labels": kerr.labels,
    "kerr_matrix_ghz": np.asarray(kerr.values),
    "q1_drive_matrix_element": complex(
        chip.drive_matrix_elements(q1, drives=[q1_line])[q1_line]
    ),
}

static_snapshot
Output:
{'q1_f01_ghz': 5.297988973339825,
 'q1_f12_ghz': 4.649377172766316,
 'kerr_labels': ('q1', 'q2', 'bus'),
 'kerr_matrix_ghz': array([[-6.48611801e-01,  1.71057586e-05, -1.35398353e-03],
        [ 1.71057586e-05, -6.48003156e-01, -2.04352737e-03],
        [-1.35398353e-03, -2.04352737e-03, -4.63804199e-06]]),
 'q1_drive_matrix_element': -0.9991667711850256j}
kerr_matrix() puts the dressed anharmonicities on its diagonal and the
full-pull cross-Kerr shifts off the diagonal, in chip.devices order. The
two assertions above check its entries against the scalar APIs.
The resolved Hamiltonian applies the chip’s basis, frame, and approximation strategy through the same public path that simulation uses.
chip.hamiltonian()
Output:
chip.resolve().dropped_terms_summary() audits the RWA without rebuilding
the Hamiltonian by hand:
rwa_summary = chip.resolve().dropped_terms_summary()
print(rwa_summary)
Output:
4 term(s) dropped:
  [q1-bus] coupling band (-1, -1) on q1·bus  (discarded by RWA band selection; amp 0.15 GHz, detuning 10.55 GHz)
  [q1-bus] coupling band (+1, +1) on q1·bus  (discarded by RWA band selection; amp 0.15 GHz, detuning 10.55 GHz)
  [q2-bus] coupling band (-1, -1) on q2·bus  (discarded by RWA band selection; amp 0.15 GHz, detuning 10.83 GHz)
  [q2-bus] coupling band (+1, +1) on q2·bus  (discarded by RWA band selection; amp 0.15 GHz, detuning 10.83 GHz)
Numerical checks and record
second_order_splitting_scale = 2.0 * coupling_strength**2 / abs(bus_frequency - q1_frequency)
relative_difference_to_second_order = (
    abs(minimum_splitting - second_order_splitting_scale) / minimum_splitting
)

if minimum_index in (0, len(q2_frequencies) - 1):
    raise RuntimeError("The avoided-crossing minimum lies at the sweep boundary.")
if not 3.95e-3 < minimum_splitting < 4.05e-3:
    raise RuntimeError("The resolved splitting does not reproduce the slide-scale exchange rate.")
if len(chip.resolve().dropped_terms) != 4:
    raise RuntimeError("The RWA ledger does not contain the four counter-rotating coupling bands.")
if chip.parameters["q2.freq"] != q2_frequency0:
    raise RuntimeError("SpectrumSweep mutated the original chip.")

statics_receipt = {
    "approximation": chip.settings["approximation"],
    "dressed_frequencies_ghz": initial_dressed_frequencies,
    "dropped_rwa_terms": len(chip.resolve().dropped_terms),
    "figure": figure_path,
    "full_dimension": int(np.prod(chip.dims)),
    "inferred_exchange_rate_mhz": 1.0e3 * inferred_exchange_rate,
    "minimum_at_bare_q2_ghz": minimum_frequency,
    "minimum_splitting_mhz": 1.0e3 * minimum_splitting,
    "original_chip_unchanged": bool(chip.parameters["q2.freq"] == q2_frequency0),
    "relative_difference_to_second_order": relative_difference_to_second_order,
    "second_order_splitting_scale_mhz": 1.0e3 * second_order_splitting_scale,
    "static_zz_khz": 1.0e6 * initial_static_zz,
    "sweep_points": len(q2_frequencies),
}

print(f"RESULT statics={json.dumps(statics_receipt, sort_keys=True, separators=(',', ':'))}")
Output:
RESULT statics={"approximation":"RWA","dressed_frequencies_ghz":{"bus":6.554557999183753,"q1":5.297988973339825,"q2":5.577453027476421},"dropped_rwa_terms":4,"figure":"../docs/images/resolve_and_sweep.svg","full_dimension":64,"inferred_exchange_rate_mhz":1.9936406352263347,"minimum_at_bare_q2_ghz":5.3,"minimum_splitting_mhz":3.9872812704526694,"original_chip_unchanged":true,"relative_difference_to_second_order":0.0031898250172573274,"second_order_splitting_scale_mhz":4.000000000000001,"static_zz_khz":17.10575862112762,"sweep_points":181}
Change one design parameter
with_params() changes one bare frequency and keeps the source chip unchanged.
shifted_chip = chip.with_params({"q2.freq": 5.40})

{
    "original_q2_freq": chip.parameters["q2.freq"],
    "shifted_q2_freq": shifted_chip.parameters["q2.freq"],
    "shifted_dressed_q2_freq": float(shifted_chip.freq("q2")),
}
Output:
{'original_q2_freq': 5.58,
 'shifted_q2_freq': 5.4,
 'shifted_dressed_q2_freq': 5.39787715533777}
Independent and linked parameter studies
Sweep.expand() shows the parameter dictionaries before a calculation starts.
Independent axes form a Cartesian grid. If the parameters must move together,
Sweep.zip() pairs the values.
frequency_values = Sweep([5.28, 5.30, 5.32], name="q2.freq")
coupling_values = Sweep([0.045, 0.050], name="q1-bus.g")
independent_points = Sweep.expand([frequency_values, coupling_values])

linked_points = Sweep.expand(
    [
        Sweep.zip(
            Sweep([5.28, 5.30, 5.32], name="q2.freq"),
            Sweep([0.045, 0.050, 0.055], name="q1-bus.g"),
        )
    ]
)

{
    "independent_point_count": len(independent_points),
    "first_independent_point": independent_points[0],
    "linked_point_count": len(linked_points),
    "last_linked_point": linked_points[-1],
}
Output:
{'independent_point_count': 6,
 'first_independent_point': {'q2.freq': np.float64(5.28),
  'q1-bus.g': np.float64(0.045)},
 'linked_point_count': 3,
 'last_linked_point': {'q2.freq': np.float64(5.32),
  'q1-bus.g': np.float64(0.055)}}
If each point needs a dressed spectrum, pass one of the two axis lists to
SpectrumSweep. If you need only a few points or a custom observable,
use with_params() directly.
Check labels before interpreting branches
Near an avoided crossing, several bare product states can share a dressed eigenstate.
dressed_index() tracks the assigned branch across the sweep, and assignment_overlaps
records the squared overlap with the assigned bare state. For one chip, state_components()
shows the largest bare-basis weights.
q1_components = chip.state_components({q1: 1}, n_components=4)

{
    "tracked_grid_shape": q1_assignment.shape,
    "lowest_q1_assignment_overlap": float(np.nanmin(q1_assignment_overlap)),
    "q1_like_state_components": q1_components,
}
Output:
{'tracked_grid_shape': (181,),
 'lowest_q1_assignment_overlap': 0.4984151979741138,
 'q1_like_state_components': {(1, 0, 0): 0.9983342366403108,
  (0, 0, 1): 0.0016149966002939823,
  (0, 1, 0): 5.076675939518521e-05,
  (0, 0, 2): 4.930380657631324e-32}}
At the crossing, each dressed branch contains approximately equal bare qubit
weights. A lower overlap_threshold keeps these labels but does not improve
their physical assignment.
Check numerical resolution
The sweep grid resolves the minimum, while device levels control the
Hilbert-space truncation, and these are separate convergence questions. Here
the 181-point grid and its every-second-point subset agree, because both
contain the symmetry point.
fine_minimum = float(np.min(splitting))
coarse_minimum = float(np.min(splitting[::2]))

{
    "fine_grid_points": len(splitting),
    "coarse_grid_points": len(splitting[::2]),
    "minimum_difference_hz": 1.0e9 * abs(fine_minimum - coarse_minimum),
}
Output:
{'fine_grid_points': 181,
 'coarse_grid_points': 91,
 'minimum_difference_hz': 0.0}
Check the local-level convergence separately for the reported transition, matrix element, or dispersive shift.
Paper example: experimental fluxonium spectroscopy
Stefanski et al. measured a fluxonium and its readout resonator versus external flux. Their paper, Improved fluxonium readout through dynamic flux pulsing, reports the fitted circuit parameters and the readout operating points. The authors also publish their analysis and modelling code and the measurement archive.
We first reproduce the qubit spectrum with one Fluxonium, then add the
readout resonator.
Load the published measurements
processed_data_fx8.csv contains measured qubit frequencies and the
authors’ fitted parameters. res_fit_results.csv contains the conditional
resonator frequencies and the paper’s \(\chi_{\rm paper}=(f_{r,1}-f_{r,0})/2\).
We convert these data to quchip’s coefficient \(\chi_Z=-\chi_{\rm paper}\),
with \(Z=|0\rangle\langle0|-|1\rangle\langle1|\).
import csv
import io
from urllib.request import urlopen

from quchip import CouplingModel, Exact, Fluxonium, Scalar, parameter

paper_data_root = (
    "https://raw.githubusercontent.com/AndersenQubitLab/"
    "FPA-RO-experimental/57dc268dd048d1372db082c3ddd97a04871580bf"
)


def published_rows(filename):
    url = f"{paper_data_root}/{filename}"
    with urlopen(url) as response:  # noqa: S310 - fixed public research archive
        return list(csv.DictReader(io.StringIO(response.read().decode("utf-8"))))


spectrum_rows = published_rows("processed_data_fx8.csv")
readout_rows = published_rows("res_fit_results.csv")

fitted_values = np.asarray(
    [float(spectrum_rows[index]["energy_params"]) for index in range(5)]
)
resonator_frequency, readout_coupling, paper_E_J, paper_E_C, paper_E_L = fitted_values

paper_parameters = {
    "E_J_ghz": paper_E_J,
    "E_C_ghz": paper_E_C,
    "E_L_ghz": paper_E_L,
    "resonator_frequency_ghz": resonator_frequency,
    "readout_coupling_ghz": readout_coupling,
}

paper_parameters
Output:
{'E_J_ghz': np.float64(3.8217399868188027),
 'E_C_ghz': np.float64(0.8652719648666846),
 'E_L_ghz': np.float64(0.8215798519627777),
 'resonator_frequency_ghz': np.float64(5.175140901166961),
 'readout_coupling_ghz': np.float64(0.037156311892102264)}
Reproduce the qubit spectrum
Figure 2 of the paper covers \(0.5\leq\Phi_{\mathrm{ext}}/\Phi_0\leq0.85\). The model curve uses 351 evenly spaced flux values, more than twice the measurement density. To evaluate the residuals, we interpolate that independent curve at the measured coordinates. quchip receives the authors’ fitted energies unchanged.
paper_flux_all = np.asarray(
    [float(row["phi_ext_qubit"]) for row in spectrum_rows if row["phi_ext_qubit"]]
)
measured_f01_all = np.asarray(
    [float(row["qubit_freq"]) for row in spectrum_rows if row["qubit_freq"]]
)
figure_2_window = paper_flux_all <= 0.85
paper_flux = paper_flux_all[figure_2_window]
measured_f01 = measured_f01_all[figure_2_window]


def isolated_f01(phi_ext):
    q = Fluxonium(
        E_C=paper_E_C,
        E_J=paper_E_J,
        E_L=paper_E_L,
        phi_ext=phi_ext,
        levels=4,
        num_basis=300,
        phi_max=5.0 * np.pi,
        basis="eigen",
        label="q",
    )
    return float(q.freq)
Evaluate the spectrum on its own flux grid and compare it with the measured points.
paper_model_flux = np.linspace(0.5, 0.85, 351)
predicted_f01_grid = np.asarray([isolated_f01(phi) for phi in paper_model_flux])
predicted_f01_at_data = np.interp(paper_flux, paper_model_flux, predicted_f01_grid)
f01_residual_mhz = 1.0e3 * (predicted_f01_at_data - measured_f01)
Plotting code
paper_spectrum_figure, (spectrum_axis, residual_axis) = plt.subplots(
    2,
    1,
    figsize=(7.4, 6.0),
    sharex=True,
    gridspec_kw={"height_ratios": [2.3, 1.0]},
    layout="constrained",
)
spectrum_axis.scatter(
    paper_flux,
    measured_f01,
    s=12,
    color="#16181C",
    alpha=0.55,
    label="experiment",
)
spectrum_axis.plot(
    paper_model_flux,
    predicted_f01_grid,
    color="#C92F33",
    linewidth=2.2,
    label="quchip",
)
spectrum_axis.set_ylabel(r"$f_{01}$ (GHz)")
spectrum_axis.legend()

residual_axis.axhline(0.0, color="#9AA0A8", linewidth=1.0)
residual_axis.scatter(paper_flux, f01_residual_mhz, s=12, color="#246FA8", alpha=0.78)
residual_axis.set(
    xlabel=r"External flux $\Phi_{\mathrm{ext}}/\Phi_0$",
    ylabel="model - data\n(MHz)",
)

paper_spectrum_path = "../docs/images/stefanski_fluxonium_spectrum.svg"
paper_spectrum_figure.savefig(paper_spectrum_path)
plt.show()
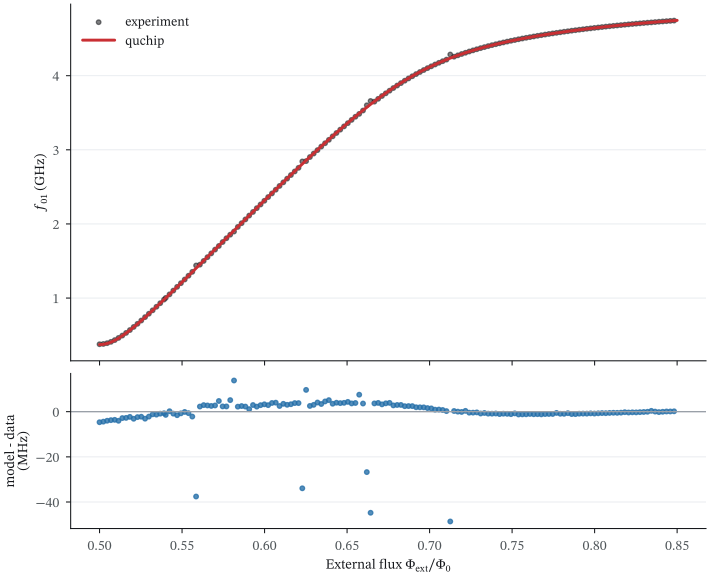
The authors’ fitted fluxonium energies reproduce the measured frequency curve. Every extracted point in the paper’s Figure 2 window is shown.
spectrum_check = {
    "measurement_points": len(measured_f01),
    "median_absolute_error_mhz": float(np.median(np.abs(f01_residual_mhz))),
    "p95_absolute_error_mhz": float(np.quantile(np.abs(f01_residual_mhz), 0.95)),
    "rmse_mhz": float(np.sqrt(np.mean(f01_residual_mhz**2))),
    "points_above_10_mhz": int(np.count_nonzero(np.abs(f01_residual_mhz) > 10.0)),
}
spectrum_check
Output:
{'measurement_points': 153,
 'median_absolute_error_mhz': 1.5923938298776363,
 'p95_absolute_error_mhz': 6.0767685282924555,
 'rmse_mhz': 7.573880277392827,
 'points_above_10_mhz': 6}
The six residuals above 10 MHz stay in the plot and in the RMSE. The median and 95th percentile describe the rest of the curve, and no points are deleted.
Add the readout resonator
The released model couples a resonator to the fluxonium oscillator coordinate
\(c\) through \(g(ca^\dagger+c^\dagger a)\). CouplingModel is quchip’s public
extension point for declaring that interaction without changing the device
models.
class FluxoniumReadoutCoupling(CouplingModel):
    """Exchange interaction used in the authors' released readout model."""

    g: Scalar = parameter(unit="GHz")
    oscillator_length: Scalar = parameter(positive=True)

    def interaction(self, q, r, p):
        scale = np.sqrt(2.0)
        lowering = q.phi * (1.0 / (p.oscillator_length * scale)) + (
            1j * p.oscillator_length / scale
        ) * q.charge
        raising = q.phi * (1.0 / (p.oscillator_length * scale)) - (
            1j * p.oscillator_length / scale
        ) * q.charge
        return p.g * (lowering * r.adag + raising * r.a)
Use the published interaction with the fitted circuit parameters. Keep every
coupling band with Exact(). Counter-rotating terms contribute strongly to the
fluxonium’s dispersive shift, and under RWA() the \(\chi_Z\) RMSE against the
data increases from 0.77 MHz to 1.42 MHz.
paper_q = Fluxonium(
    E_C=paper_E_C,
    E_J=paper_E_J,
    E_L=paper_E_L,
    phi_ext=0.5,
    levels=10,
    num_basis=300,
    phi_max=5.0 * np.pi,
    basis="eigen",
    label="q",
)
paper_readout = Resonator(freq=resonator_frequency, levels=3, label="readout")
paper_edge = FluxoniumReadoutCoupling(
    paper_q,
    paper_readout,
    g=readout_coupling,
    oscillator_length=(8.0 * paper_E_C / paper_E_L) ** 0.25,
    label="q-readout",
)

paper_chip = Chip(
    [paper_q, paper_readout],
    [paper_edge],
    basis="eigen",
    frame="lab",
    approximation=Exact(),
)
chip.freq("readout") is the resonator transition with the qubit in
\(|0\rangle\). chip.dispersive_shift() returns the full state-dependent pull.
Its negative half is \(\chi_Z\), the coefficient of \(Z n_r\) in \(H/h\).
readout_rows = [row for row in readout_rows if row["phi_ext_disshift"]]
readout_flux_all = np.asarray([float(row["phi_ext_disshift"]) for row in readout_rows])
measured_fr0_all = np.asarray([float(row["fr_q0"]) for row in readout_rows])
measured_fr1_all = np.asarray([float(row["fr_q1"]) for row in readout_rows])
measured_chi_all = -np.asarray([float(row["chi"]) for row in readout_rows])

readout_window = readout_flux_all <= 0.85
readout_flux = readout_flux_all[readout_window]
measured_fr0 = measured_fr0_all[readout_window]
measured_fr1 = measured_fr1_all[readout_window]
measured_chi_mhz = measured_chi_all[readout_window]
At each flux, ask the same chip for the two conditional readout frequencies.
def readout_observables(phi_ext):
    point = paper_chip.with_params({"q.phi_ext": phi_ext})
    fr0 = float(point.freq("readout"))
    full_pull = float(point.dispersive_shift("q", "readout"))
    return fr0, fr0 + full_pull, -500.0 * full_pull


readout_model_flux = np.linspace(0.5, 0.85, 351)
predicted_readout_grid = np.asarray(
    [readout_observables(phi) for phi in readout_model_flux]
)
predicted_fr0_grid = predicted_readout_grid[:, 0]
predicted_fr1_grid = predicted_readout_grid[:, 1]
predicted_chi_grid_mhz = predicted_readout_grid[:, 2]

predicted_fr0_at_data = np.interp(readout_flux, readout_model_flux, predicted_fr0_grid)
predicted_fr1_at_data = np.interp(readout_flux, readout_model_flux, predicted_fr1_grid)
predicted_chi_at_data_mhz = np.interp(
    readout_flux,
    readout_model_flux,
    predicted_chi_grid_mhz,
)
Plotting code
readout_figure, (frequency_axis, chi_axis) = plt.subplots(
    2,
    1,
    figsize=(7.4, 6.0),
    sharex=True,
    layout="constrained",
)
frequency_axis.scatter(readout_flux, measured_fr0, s=12, color="#C92F33", alpha=0.6)
frequency_axis.scatter(readout_flux, measured_fr1, s=12, color="#246FA8", alpha=0.6)
frequency_axis.plot(
    readout_model_flux,
    predicted_fr0_grid,
    color="#C92F33",
    label=r"$q=|0\rangle$",
)
frequency_axis.plot(
    readout_model_flux,
    predicted_fr1_grid,
    color="#246FA8",
    label=r"$q=|1\rangle$",
)
frequency_axis.set_ylabel("Readout frequency (GHz)")
frequency_axis.legend(ncols=2)

chi_axis.scatter(
    readout_flux,
    measured_chi_mhz,
    s=12,
    color="#16181C",
    alpha=0.55,
    label="experiment",
)
chi_axis.plot(
    readout_model_flux,
    predicted_chi_grid_mhz,
    color="#C92F33",
    linewidth=2.0,
    label="quchip",
)
chi_axis.set(
    xlabel=r"External flux $\Phi_{\mathrm{ext}}/\Phi_0$",
    ylabel=r"$\chi_Z$ (MHz)",
)
chi_axis.legend()

paper_readout_path = "../docs/images/stefanski_fluxonium_readout.svg"
readout_figure.savefig(paper_readout_path)
plt.show()
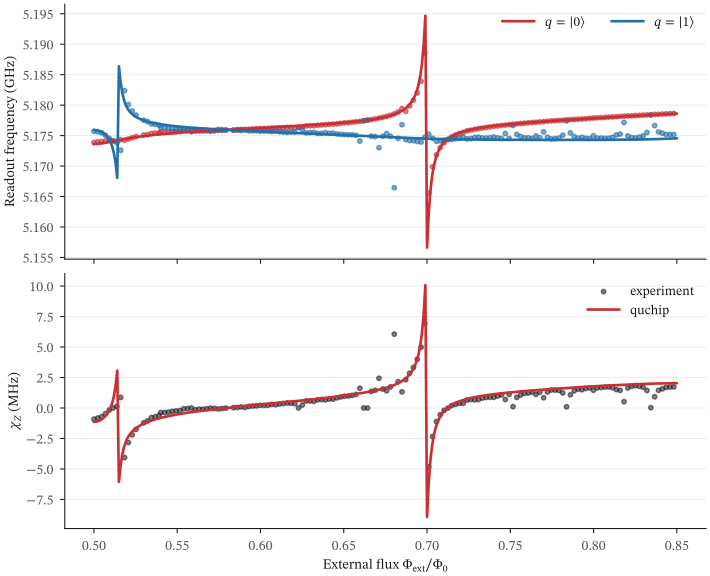
The same chip reproduces the state-dependent readout frequencies and the higher-level resonances in the dispersive shift.
The paper operates at the sweet spot for idle and control, then pulses to \(\Phi_{\mathrm{ext}}/\Phi_0=0.6567\) during readout. These two points give a compact numerical check against the values in the text. Both sets of dispersive coefficients below use quchip’s \(\chi_Z\) convention.
sweet_spot = readout_observables(0.5)
flux_pulsed = readout_observables(0.6567)

operating_points = {
    "sweet_spot": {
        "paper_f01_ghz": 0.377,
        "quchip_f01_ghz": isolated_f01(0.5),
        "paper_fr0_ghz": 5.1739,
        "quchip_fr0_ghz": sweet_spot[0],
        "paper_chi_z_mhz": -0.92,
        "quchip_chi_z_mhz": sweet_spot[2],
    },
    "flux_pulsed_readout": {
        "paper_flux": 0.6567,
        "paper_f01_ghz": 3.47,
        "quchip_f01_ghz": isolated_f01(0.6567),
        "paper_chi_z_mhz": 1.09,
        "quchip_chi_z_mhz": flux_pulsed[2],
    },
}

operating_points
Output:
{'sweet_spot': {'paper_f01_ghz': 0.377,
  'quchip_f01_ghz': 0.37229583974981484,
  'paper_fr0_ghz': 5.1739,
  'quchip_fr0_ghz': 5.173631975636759,
  'paper_chi_z_mhz': -0.92,
  'quchip_chi_z_mhz': -1.1418029950416297},
 'flux_pulsed_readout': {'paper_flux': 0.6567,
  'paper_f01_ghz': 3.47,
  'quchip_f01_ghz': 3.4802282134309794,
  'paper_chi_z_mhz': 1.09,
  'quchip_chi_z_mhz': 1.135184138345846}}
Numerical record
resonator_residual_mhz = 1.0e3 * np.concatenate(
    [predicted_fr0_at_data - measured_fr0, predicted_fr1_at_data - measured_fr1]
)
chi_residual_mhz = predicted_chi_at_data_mhz - measured_chi_mhz

paper_receipt = {
    "chi_median_absolute_error_mhz": float(np.median(np.abs(chi_residual_mhz))),
    "chi_rmse_mhz": float(np.sqrt(np.mean(chi_residual_mhz**2))),
    "readout_frequency_rmse_mhz": float(
        np.sqrt(np.mean(resonator_residual_mhz**2))
    ),
    "readout_points": len(readout_flux),
    "readout_model_points": len(readout_model_flux),
    "spectrum_median_absolute_error_mhz": spectrum_check["median_absolute_error_mhz"],
    "spectrum_p95_absolute_error_mhz": spectrum_check["p95_absolute_error_mhz"],
    "spectrum_points": len(paper_flux),
    "spectrum_model_points": len(paper_model_flux),
}

print(
    "RESULT paper_statics="
    + json.dumps(paper_receipt, sort_keys=True, separators=(",", ":"))
)
Output:
RESULT paper_statics={"chi_median_absolute_error_mhz":0.1767470986041748,"chi_rmse_mhz":0.7651558998064251,"readout_frequency_rmse_mhz":1.0847642735008483,"readout_model_points":351,"readout_points":151,"spectrum_median_absolute_error_mhz":1.5923938298776363,"spectrum_model_points":351,"spectrum_p95_absolute_error_mhz":6.0767685282924555,"spectrum_points":153}
The authors fitted the circuit parameters to these measurements, so use this result as a cross-implementation check of their static model. A fabrication-level prediction needs independent circuit parameters.